
Alligator Creek (2030) (Tidal Segment), covering 172 acres, is a bay situated in Sarasota County, with the associated WBID(s): 2030.
Note that this waterbody is impaired for one or more parameters including Mercury. All recreational marine waters in Florida are impaired for Mercury based on fish tissue assessments and a statewide Total Maximum Daily Load (TMDL) pollutant limit for Mercury has been adopted in response. The largest sources of Mercury are from air pollution generated from local and global power plants.
This waterbody is located within: Lemon Bay Basin
This waterbody is impaired according to the Florida Dept. of Environmental Protection's (FDEP) implementation of the Impaired Waters Rule (IWR). The FDEP evaluates whether waters meet their designated uses, which include aquatic life use support, primary contact and recreation use support, fish and shellfish consumption use support, and drinking water use support. View the full impaired waters section »
Impairment Status
Impaired
Water Body Class(es)
3M
Water Body Type(s)
ESTUARY
View Maps / Data
CHNEP's Comprehensive Conservation and Management Plan (CCMP) identified four action plans: water quality improvement; hydrological restoration; fish, wildlife, and habitat improvement; and public engagement. Click on the interactive maps below to view data associated with these goals and actions.


Water Quality Snapshot
The Water Quality Snapshot compares the most current water quality data to applicable water quality standards for Chlorophyll a, Phosphorus, Nitrogen, Bacteria, and Dissolved Oxygen to provide a snapshot of how a waterbody is doing. Water quality standards are outlined in Florida Administrative Code 62-302 for fresh/marine waterbodies of different types and uses. A Water Body Identification number (WBID) is an assessment unit that is intended to represent Florida’s waterbodies at the watershed or sub-watershed scale. The assessment units are drainage basins, lakes, lake drainage areas, springs, rivers and streams, segments of rivers and streams, coastal, bay and estuarine waters in Florida.
There are no WBIDs with water quality data at this time.
View Detailed Data About the Following Topics:
Water Quality(Red Tide, Nutrient Chemistry, Water Clarity, Salinity, Bacteria, Dissolved Oxygen, Other Indicators, Impaired Waters)


Habitats / Ecology(Seagrass Coverage, Artificial Reefs)


Recreation
Photos

_Hydrograss and Plantings_12-9-2013.JPG)


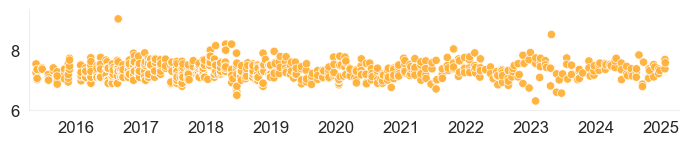
2 Year Graph
10 Year Graph
Seasonal Variation Graph
Graph Details and Help
Water quality data is displayed as a scatter-plot with data from individual sampling events displayed by date, for the previous two- and ten-year periods. Data from all available sources are plotted together. Clicking on a graph will open a larger version of it. To view/download data older than ten years, or to view/download data from individual data source(s), click the "Download Data" icon or button.
The scale used is chosen to accommodate typical values for the water quality parameter being graphed. Units are shown on the y-axis and in the graph title.
Graphs are generated and stored in the Water Atlas database on a periodic basis using an automated process. The date when the graph was created is shown.
The Seasonal Variation Graph displays a statistical summary of data from all available data sources for the entire period of record. It is used to illustrate typical variation in the selected water quality parameter from month to month during the year. The diagram below shows how to read the graph:

The median value is shown. Although not specifically marked on the graph, the mean (average) value is midway between the 25th and 75th percentiles.
The "whiskers" indicate the range of the sample values; those that are outside pre-defined "Minimum" and "Maximum" values are excluded. Sample data less than the Minimum or greater than the Maximum are considered to be outliers and are not displayed on the graph.